Boxplots on TI Nspire
Collect data from Spotify and present as a boxplot.
$0.00
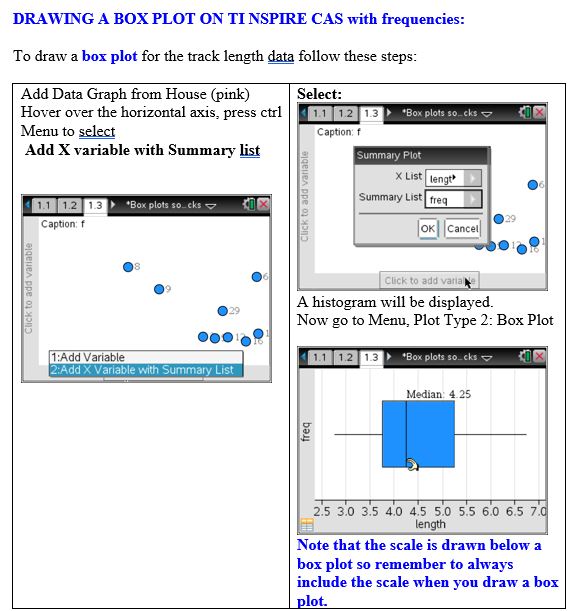
Gather your unique dataset and create a boxplot to visualize it. For instance, you might choose to compile data on the durations of the top 50 songs currently trending on Spotify. Input this data into your calculator, conduct one-variable statistical analysis, and generate a boxplot for a comprehensive understanding of the dataset’s distribution.