Type I and Type II errors in hypothesis testing.
$0.00
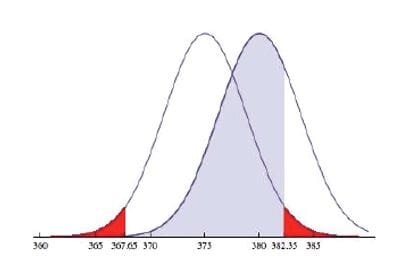
- The null hypothesis distribution shows all possible results you’d obtain if the null hypothesis is true. The correct conclusion for any point on this distribution means not rejecting the null hypothesis.
- The alternative hypothesis distribution shows all possible results you’d obtain if the alternative hypothesis is true. The correct conclusion for any point on this distribution means rejecting the null hypothesis.
Type I and Type II errors occur where these two distributions overlap. The blue shaded area (refer to the power point) represents alpha, the Type I error rate, and the green shaded area represents beta, the Type II error rate.
By setting the Type I error rate, you indirectly influence the size of the Type II error rate as well.
It’s important to strike a balance between the risks of making Type I and vice versa.
How can we reduce the risk of making Type I error? And Type II error?
The power point explains the concept with plenty of examples. By practising how to calculate the critical region, Type II error and exam type problems will prepare you for the end of year examination and school-assessed coursework.