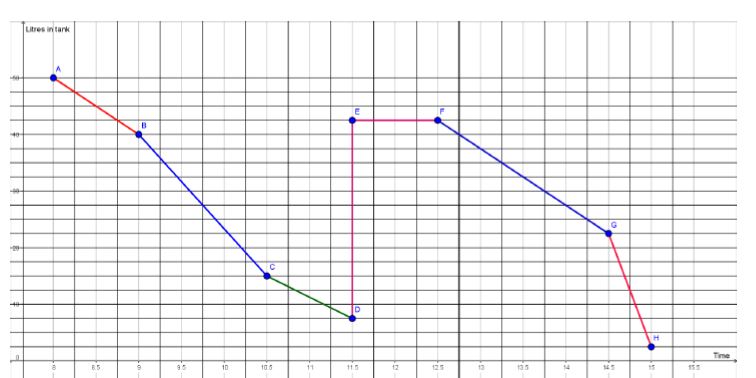
Gradient travel graph
Applications of gradient to speed-time graphs.
$0.00
Given the travel graph, answer the series of questions about your trip. How much petrol will you need to complete your journey? This graph shows the petrol level in Mia’s car during a long trip home. The gradient of the graph (between the points) tells us about the trip. Mia started her trip at 8 am (A) with 50 litres of petrol in her tank and arrived home (H) at 3 pm with 2.5 litres of petrol.

