Linear regression on TI Nspire CAS
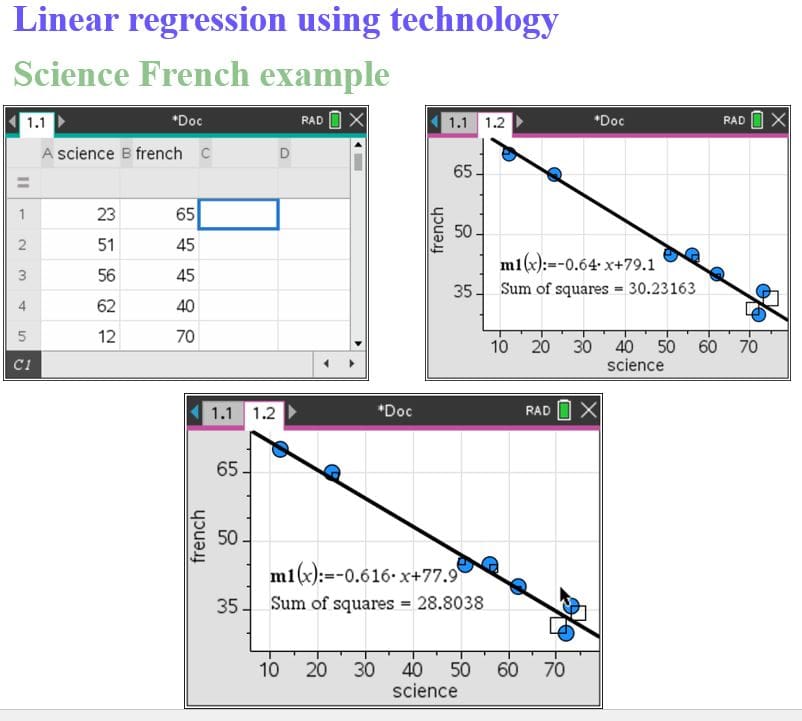
- Step-by-step guide on entering data into the calculator.
- Instructions on creating a scatter plot.
- How to calculate the line of best fit and correlation coefficient.
- A variety of problems with different datasets.
- Space for students to enter data, create scatter plots, and find the line of best fit.
- Detailed solutions for each practice problem.
- Explanations of the steps taken to solve each problem using the TI-Nspire CAS.
$0.00
Prepare for your Year 10 Maths exam and test with our focused practice handout and PowerPoint presentation on linear regression using the TI-Nspire CAS calculator. Learn to enter data, create scatter plots, and calculate the line of best fit with step-by-step instructions and detailed solutions. Our resources are designed to help you grasp key concepts and build confidence through practical exercises. Start practicing today!

