Y10 Statistics boxplots from grouped data TI Nspire CAS
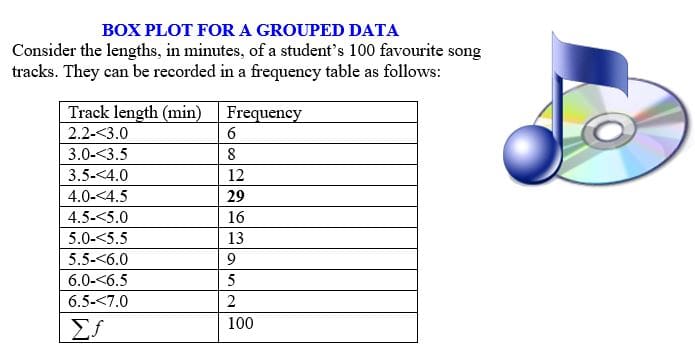
Consider the lengths, in minutes, of a student’s 100 favourite song tracks
$0.00
Learn how to use your TI Nspire CAS calculator to create a boxplot from a grouped data. Select your favourite songs from Spotify, enter in the Lists & Spreadsheets and follow the instructions how to draw a boxplot and obtain all relevant statistics.

