Yacht Race Year 10 Linear Graphs Activity
In this theoretical modeling activity, students will use linear graphs to simulate and analyze a yacht race. By representing the yachts’ positions as linear equations, students can predict and interpret which yacht will win the race based on their respective speeds and starting positions.
$0.00
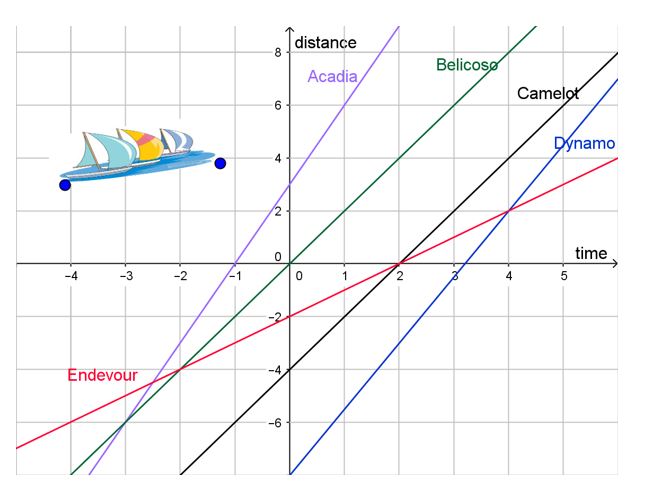
- Have students graph the equations they’ve created on a coordinate plane. Ensure that they label the axes appropriately and include any given starting positions.
- Interpretation : After graphing, ask students to analyze the graphs and determine which yacht will win the race and when it will happen. They should look for the point where one yacht overtakes the other, indicating the winner.
- Class Discussion: Facilitate a class discussion where students present their findings and reasoning. Encourage them to explain how they reached their conclusions based on the graphs and the equations they developed.
- Conclusion : Summarize the key points of the activity, emphasizing the use of linear equations to model and predict outcomes in a real-world scenario, such as a yacht race.
- Extensions (optional): For advanced students, you can introduce more complex scenarios, such as yachts with varying speeds or different starting times, and challenge them to adapt their models accordingly.